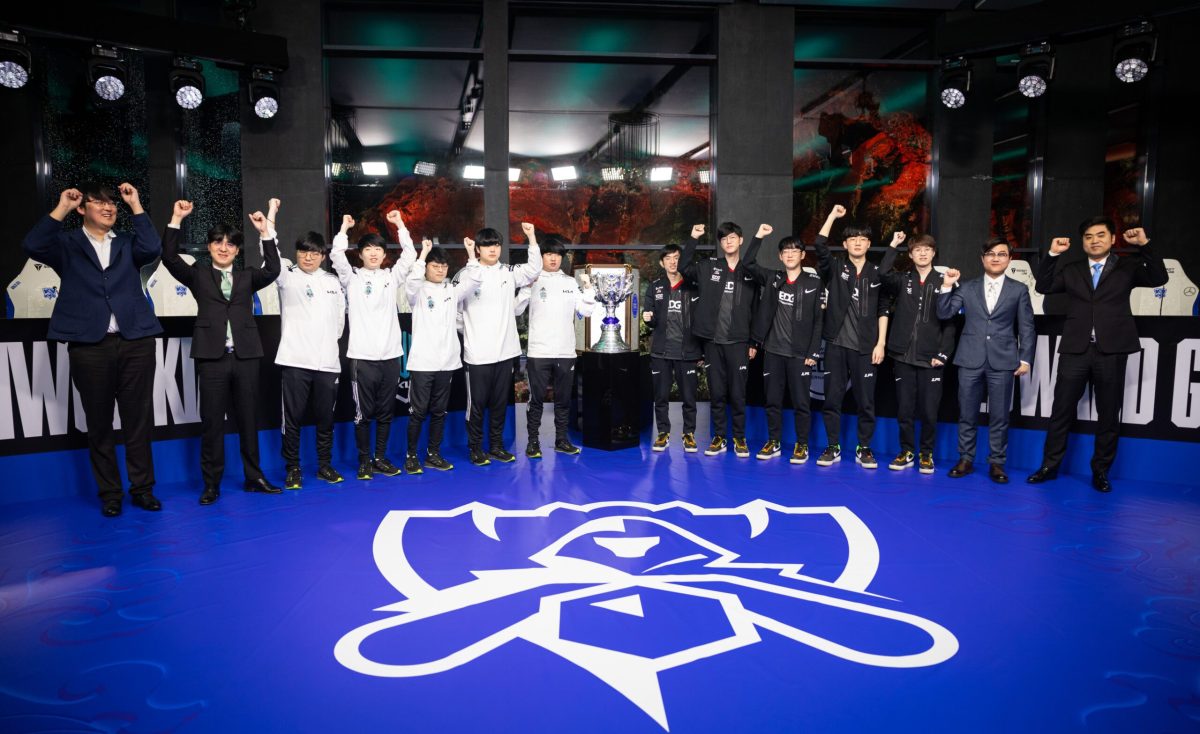
After a month of high level play from the best teams in the world, there are only two teams left standing at the 2021 League of Legends World Championship. Representing South Korea, DWG KIA, the incumbent champions, aim to repeat last year’s victory. From China, Edward Gaming have proven themselves as the strongest challenger left in the world.
Watching the culmination of the biggest event can be thrilling enough, but nothing ups the stakes like putting something extra on the line. At the same time, while betting on the team you like more is certainly fun, it’s not necessarily the best way to find betting value.
That’s where I come in. At alacrity.gg, I built a machine learning model and trained it on more than 35,000 professional League of Legends matches to predict each team’s probability of winning in any match. Squared up against the odds market, we can find matches that generate positive-value bets.
This time around, in addition to covering the usual overall winner odds, I’ll go over many of the available prop bets to see if any of them are worth your consideration and money.
Overall match bets
First up, let’s discuss various bets for the overall match. Since no in-game stats (besides the winner of each game) are relevant here, these really just boil down to various ways of looking at the match score.
Overall winner
Let’s start with the big one: who will win the match? From the match’s perspective, this is the only one that truly matters. Whether you win 3-0 or 3-2, you still take home the Summoner’s Cup.
The odds market are giving DK a massive 76-24 advantage, but my model disagrees quite strongly:


As a reference point, DK ended the League of Legends Champions Korea summer season with an overall 29-14 record, good for a 67% win rate. They did better in the spring (33-10), for a combined 72% record. That’s on a per-game basis, and a best-of-five slightly exaggerates these probabilities (ignoring momentum, a team with a 64% chance to win an individual match has about a 75% chance to win a best-of-five).
There’s no doubt that DWG KIA are an incredibly strong team, and likely the strongest team in the world right now. And while South Korea is a very competitive region, not all of its teams are of equal caliber. It seems aggressive to claim that a team with a 72% win rate over the combination of all Korean teams would have a 64% chance to win each game against the best team from China (which, by the way, is almost as strong a region).
My model would put this matchup at around 59/41, which is much closer to even. DK are still favored, and more likely to win than not, but the payout on an EDG upset makes a smallish bet worth making.
Both teams perform quite well within their own regions. Across the spring and summer seasons of the League of Legends Pro League, EDG had an overall 75% win rate, so they were actually slightly more dominant than DK. DWG KIA’s wins tended to be more absolute, with a significantly larger margin in towers destroyed, and a smaller margin in other objectives as well as gold and experience.
The rest mostly comes down to region strength. The LCK is, by my metrics, a slightly stronger region than LPL. LCK teams playing outside of the LCK, in international tournaments, perform slightly better than other teams on a relative basis. On the flip side, EDG’s squad have had more experience playing in harder settings in their careers (DK’s Worlds win a year ago notwithstanding), so regional strength comes down mostly to a wash.
In most of the metrics that my model has found to be predictive of success across all teams and all matches, these two teams are quite evenly matched. It still tilts towards DWG KIA, but not by nearly as much as the odds do, so the possibility of an EDG upset is much higher than the payout would imply.
Other match-level bets
Odds markets offer odds on a few other metrics related to the overall match:

Exact score:
You can bet on the exact score of the match. Fortunately, my model is able to simulate this:

A quick note on these probabilities: they aren’t quite as simple as just taking the single-game probabilities and running them through all of the ways to get, for example, a 3-1 outcome. I’ve found there’s some momentum at play. Winning a game usually increases a team’s probability of winning the next game in that match, depending on how lopsided the probabilities are. If you won and were expected to win, your performance doesn’t improve by as much as an underdog’s.
Matching these up against the odds market:

Since my model believes that EDG are more likely to win than the market does, it stands to reason that our calculated probabilities of any EDG-winning score are going to be higher than the market’s implied probabilities for those scores, and therefore will have positive expected value. For example, I’m calculating an 11% chance of a 3-0 EDG win while the market puts it at 6%. It’s still very unlikely to happen, but the high payout generates a pretty large expected value.
We’ve alluded to this in the past, but it’s not necessarily correct to place larger wagers on higher-EV bets. The likelihood of a payout should also matter, so don’t just throw all your money into the EDG 3-0 pot.
In addition, I’ve previously alluded to the fact that trickier bets tend to have worse payouts than they should. This manifests in the form of the vig — for more complicated or harder-to-predict bets, the oddsmaker typically takes a larger rake. The vig on a typical, head-to-head, two-sided bet is around 6% (the vig on the overall match, above, is actually around 5%). The vig on this string of bets is 15.10%, which means that you’re (on average) getting paid out 15% less than you should be in a fair market.
Total games
The market also offers odds on the total number of games in the match, offered as an over/under. You can bet on whether there will be greater than or fewer than 3.5 games, and independently greater or fewer than 4.5. The numbers are split at 0.5 because that quantity isn’t possible and leaves no ambiguity.
Well, we’ve already generated probabilities for every possible final score, which means we have probabilities for any total number of games. Under 3.5 games simply means a 3-0 or 0-3 outcome, so we can add up those probabilities and do likewise for every other combination:

Once again, a more even matchup means more games, so we find positive EV on the over side on both of these bets. Interestingly, in spite of thinking the overall match is pretty lopsided, the odds market comes in pretty close to our estimates for a high number of games. A 29% chance for a five-game series feels a lot closer than a 74/26 matchup to me, so something feels inconsistent there.
The vig on these bets is also pretty reasonable, at 6.95% and 7.14% respectively. Unfortunately, the EV just isn’t there. I may think that a five-game series is more likely than the market does, but by just barely enough to overcome the vig (in the above table, I’m showing the market’s normalized probabilities). I normally try to reserve some buffer of value — if I think that some outcome has a 21% chance of occurring compared to the market’s 20% implied, sure the EV is technically positive but it doesn’t feel like a great bet.
Match handicap
Finally, you can bet on the winner of the match, but with a handicap. For example, DWG KIA @ -1.5 means that DK have to win by at least 1.5 (so 3-0 or 3-1). Conversely, EDG +1.5 pays out at overall DK-EDG scores of 3-2, 2-3, 1-3, or 0-3.
This isn’t really a distinct bet, though. You can effectively replicate any of these bets by figuring out which outcomes they pay out in and just betting on all of those individual outcomes as we described above. A bet of this form may offer a better vig, however, since each bet only has two sides to it.
Game-specific bets
In addition to bets on the overall match, oddsmaker offer a variety of odds on just about anything that can happen in each individual game. You can place wagers on these things for any of the five games, but there’s no fundamental reason to believe that the total number of kills in game two would be systematically different from game one, so we’ll just focus on the first game for now. Otherwise, feel free to adapt this analysis (especially after seeing each game) to make your own predictions on later games.
Kills

First up, which team will get more kills? This one’s pretty straightforward. From the market’s point of view, if DK are more likely to win the game, they’re the better team and likely to score more kills. This one is 66/34 in DK’s favor, so if you think that there’s a greater than 34% chance that EDG out-kill DK, then you should bet on them.
This one’s tough to model, as are most of these types of prop bets, but I’ll leave you with this bit of analysis on each of these team’s kill and death performances:

In short games, DK tend to get more kills per minute than EDG do. But as the game goes on, the two teams tend to normalize. Conversely, in short games DK give up almost no deaths, but do tend to die more in longer games. If you think that any of these games will be longer, EDG start to look better in total kill count.
First blood and odd/even total kill counts are, to be blunt, almost completely random. Odd or even is literally just random, but I guess if people are willing to bet on it, oddsmakers are willing to offer odds on it? First blood might favor the better team, especially in very lopsided games, but is very weakly correlated to anything.
Finally, “first to X kills” should follow a similar pattern to “most kills.” If you believe DK will score more kills early on but in a long game EDG will start to even it out, then it might make sense to bet on DK first to 5 kills but EDG first to 20.
Handicaps


Total kills, total towers and even kill handicaps all share the same fundamental problem: they’re all incredibly dependent on the length of the game. In a longer game, you’ll see more kills and more towers destroyed, so really you’re betting on the game going long enough to reach whatever kill or tower threshold you need.
The kill handicaps are slightly more nuanced, but really they’re a combination of which team will get more kills (as we’ve covered above) and game length. If DK win too dominantly, the game might be over before they can reach the desired kill advantage. Suddenly, you’re betting on two things simultaneously, which is just too prone to idiosyncracy to be worth analyzing.
In short, if you want to bet on any of these, you should just bet on total duration. The over/under is set at 31 minutes, with about a 68% chance of the game going over. Given that I think the matchup is more even than the market does, it’s natural to assume that the game will typically be longer than expected as well, and therefore it’s worth betting on the over. This is a dangerous path to go down, however, and I would generally avoid placing bets unless you have the ability to create an independent, quantitative prediction on some outcome.
Specials


All of these, frankly, aren’t worth talking about too much. The data to try to make some predictions exists, but will be way too spurious to reliably find value in. Some of these also run into the same problem we just discussed, where they’re really just dependent on game length.
These bets exist for pure fun — so if you enjoy sitting on the edge of your seat hoping Baron doesn’t get sniped or hoping for a real, base-trade slugfest, then by all means bet away. I can’t in good conscience suggest any specific probabilities on the basis of any quantitative analysis, however, so proceed at your own risk.


Published: Nov 4, 2021 06:22 pm